
Annual Report, 2018
Project Type
Publication Design
Report Design
Team Collaboration
1 Data Analyst
1 Graphic Designer (me)
Role & Contributions
Graphic Design
Print & Layout Design
Project Management
Content Strategy
Programs
InDesign
Illustrator
Tableau
Overview
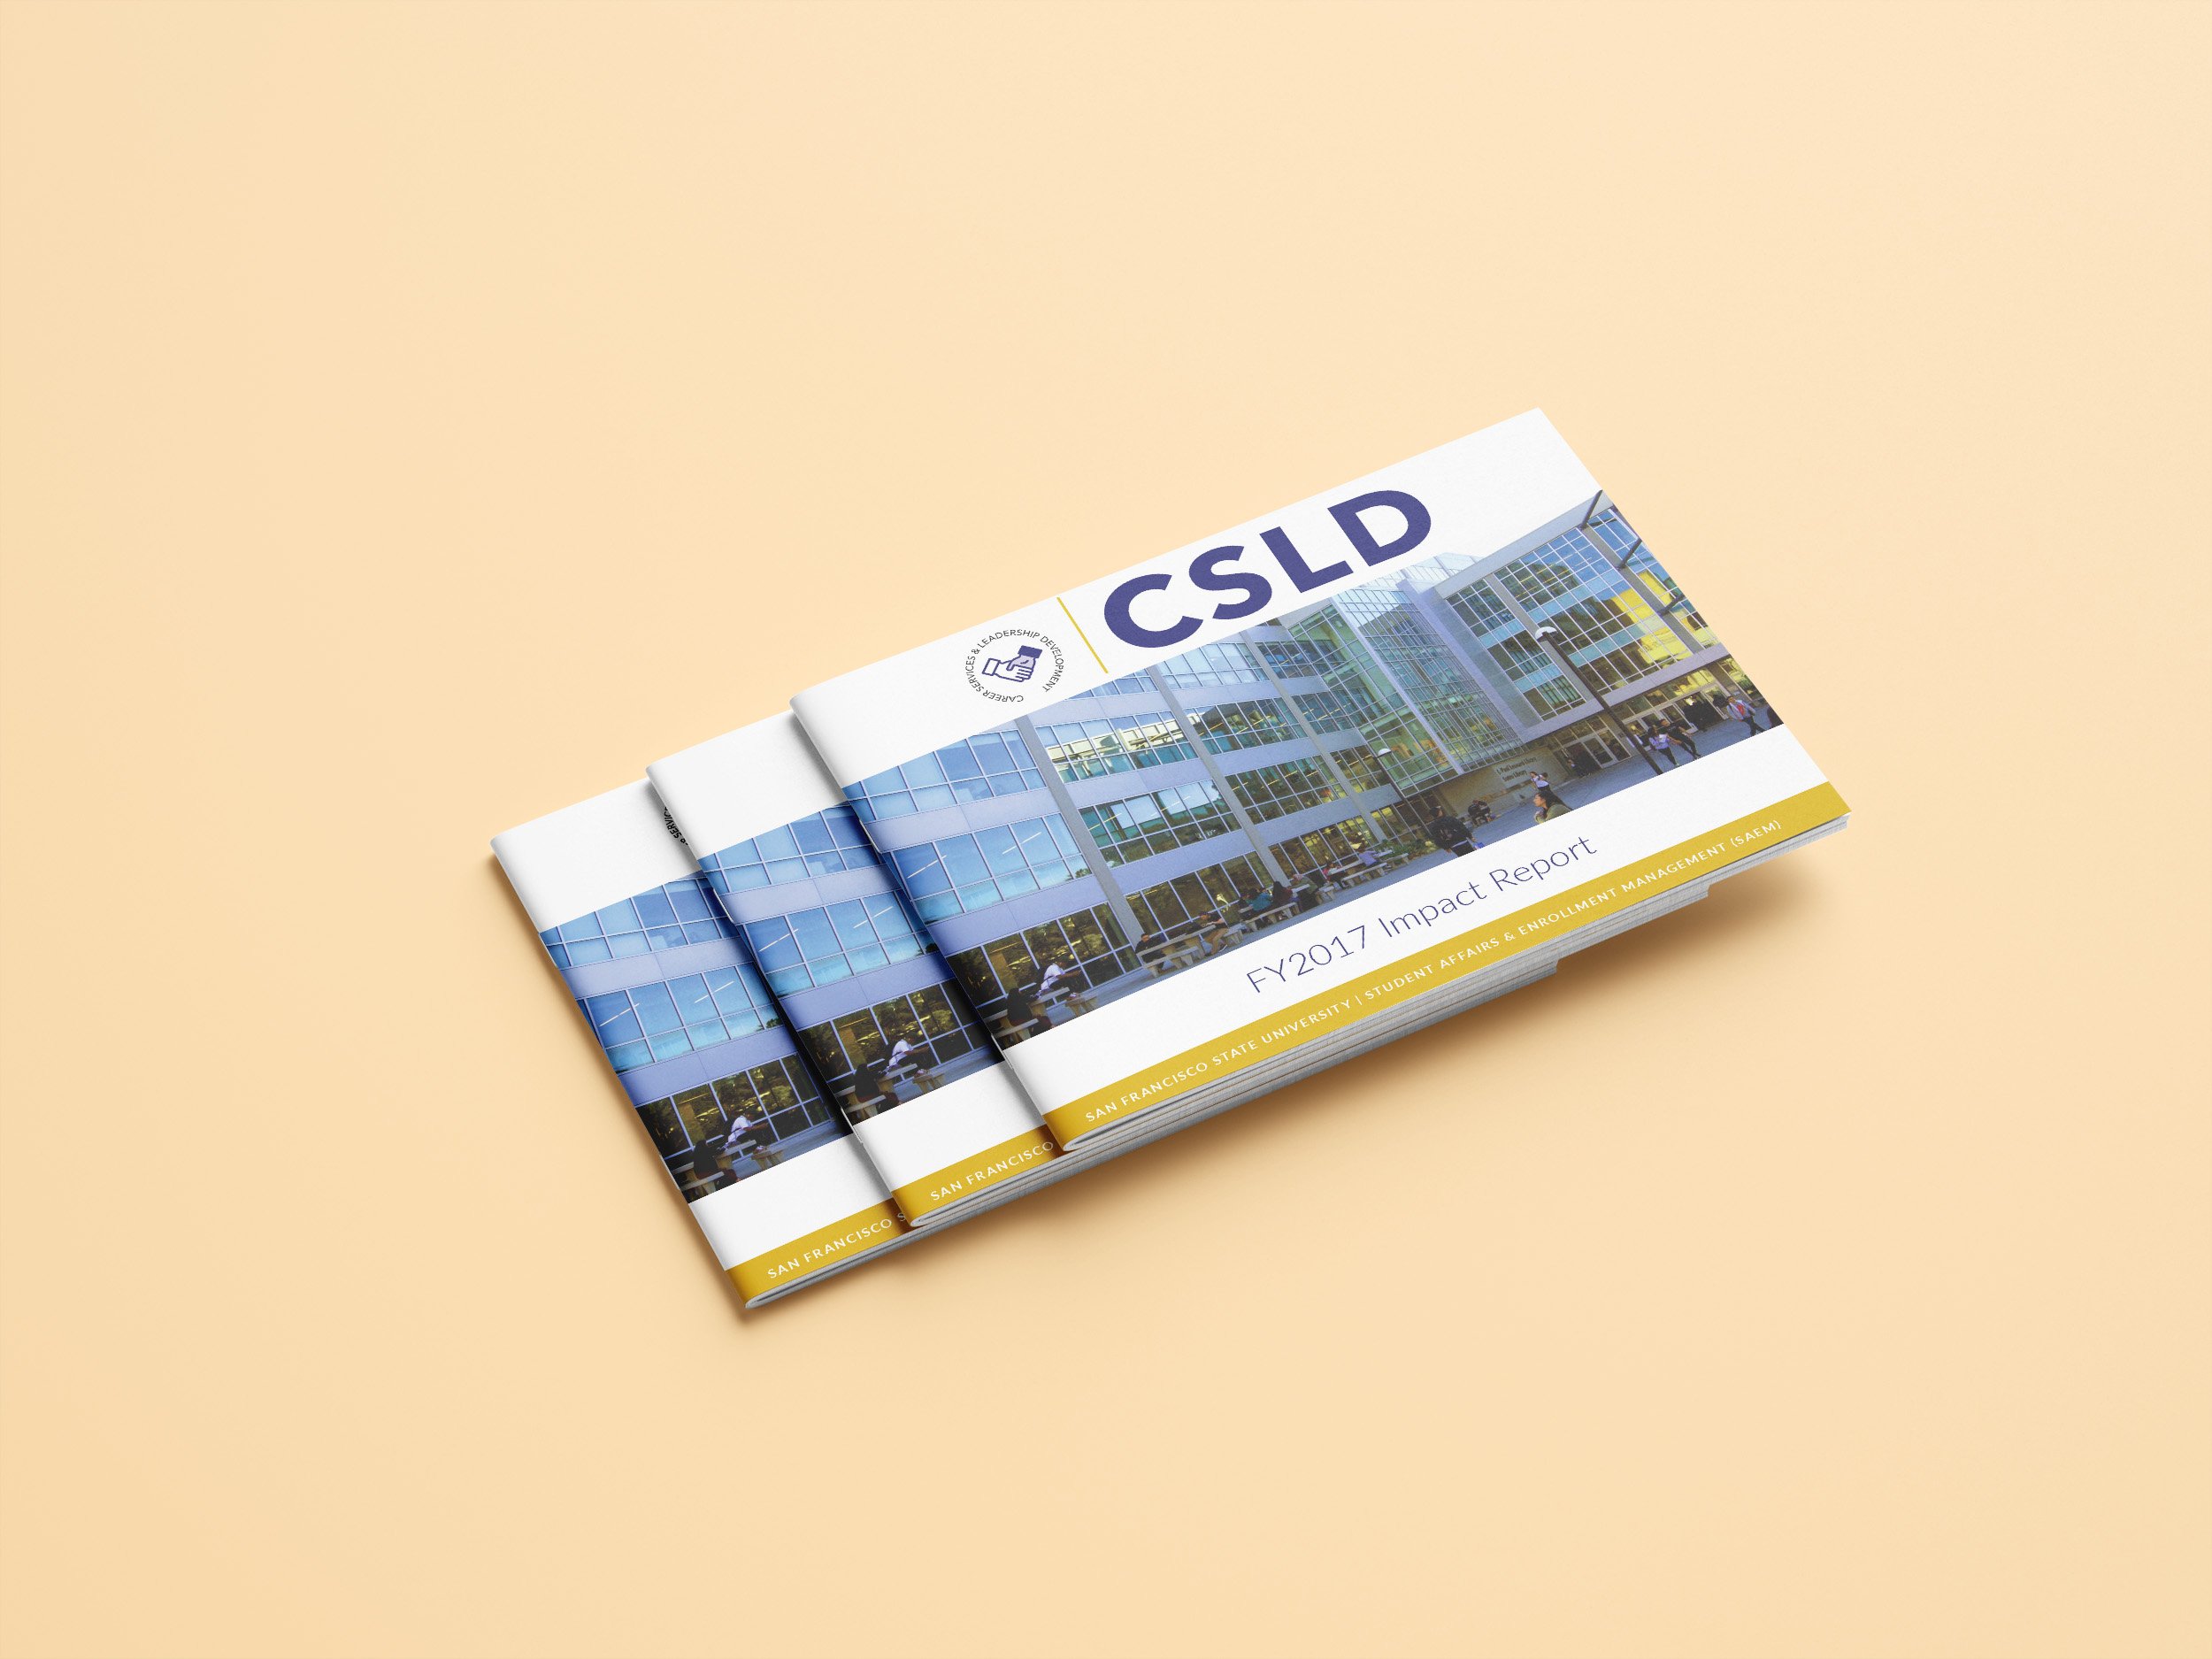
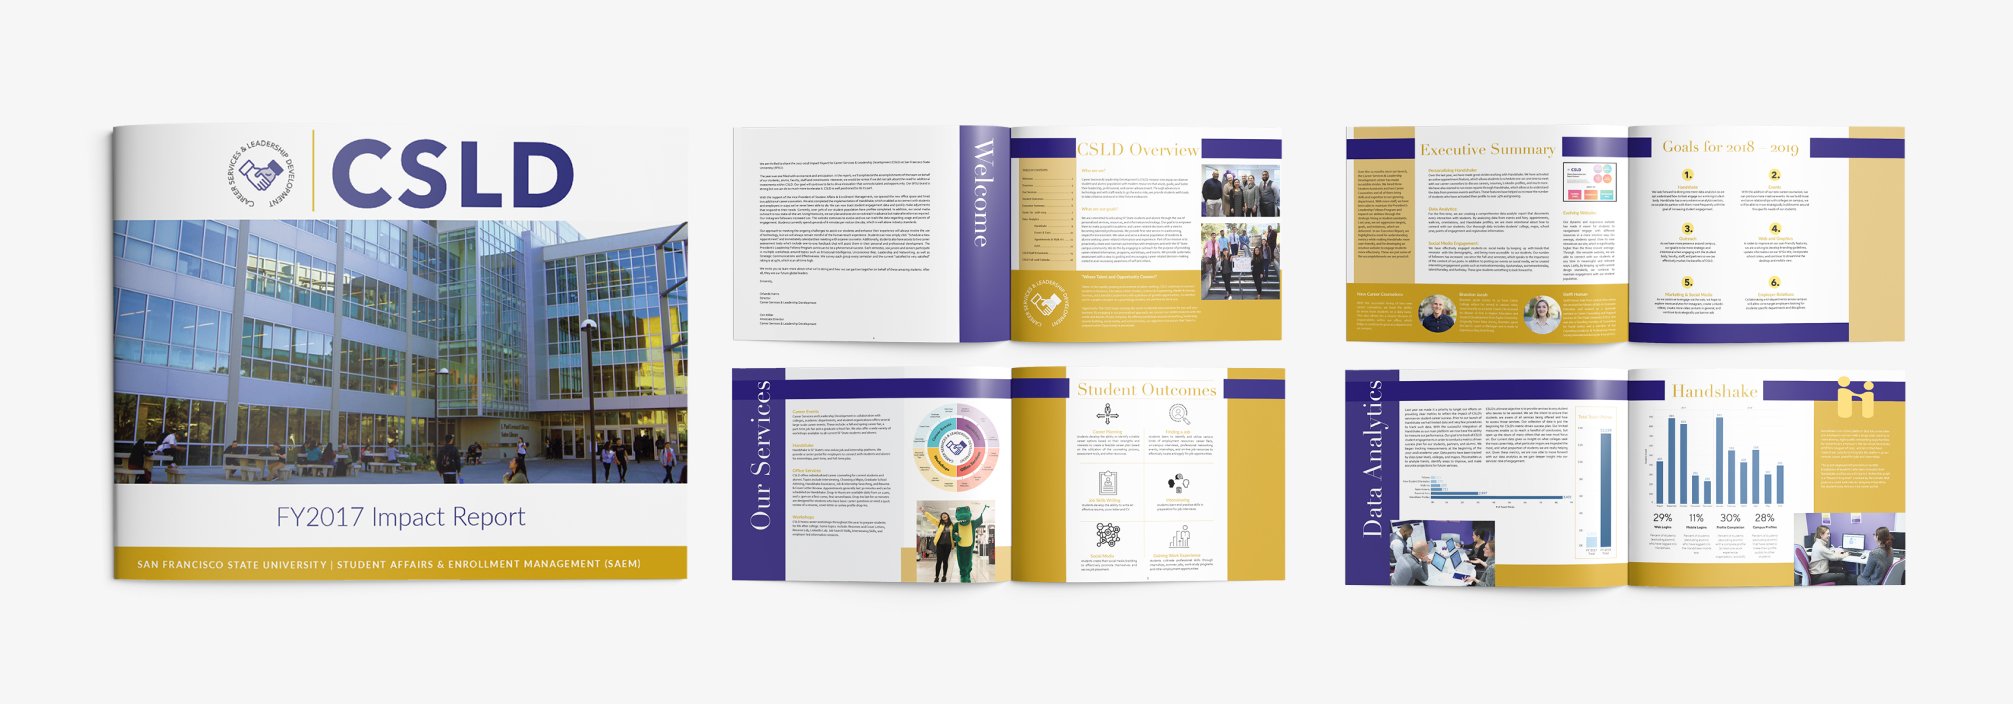
Design and strategy for CSLD’s first data-driven impact report
Career Services & Leadership Development (CSLD) is the career center at San Francisco State University. When the center expanded in 2017, CSLD integrated a new platform where students could register for our events, make appointments for our services, and search for jobs and internships through our partnered employers.
After the new platform launched, my partner took the initiative to gather all of the data points collected in our first year, and approached me with an idea to create CSLD’s first data-driven impact report.
The Goal
To produce CSLD’s first annual impact report using data from the new platform to highlight our impact on the campus community
The Challenge
To create a meaningful narrative from the data
To choose right communication strategies to convey CSLD’s message to its audience
Empathize
Understanding the design problem
I began by scheduling a kick-off meeting with my partner to gain empathy and insight into the design problem.
What are we communicating?
In this meeting, I discussed my concerns around the initial proposal to present a report of graphs without any context or communication behind them.
To offer solutions, I asked key design questions for us to better understand the message that we want to convey.

What are we working with?
I first proposed that we try to gain some insights from the data to form a story or narrative to share. However, after reviewing the data together, we could not see any obvious insights from the data on its own. This led me to investigate further by seeking any previous data or claims that we could use to scaffold our report.
As a result, I was able to find our previous years executive report where I found claims our directors had made of our future goals and milestones. From here, we could create a cohesive message to our audience by using the previous claims as an outline.

Define
Identifying challenges and constraints
In our discovery phase, we realized that the data alone does not communicate a clear message, and that although a lot of data had been collected, not all of it was relevant or necessary for the purpose of the report. However, in reviewing the data, we found ourselves asking questions like, “If we had more data on this, what could it show?”
Working within our limitations
Given these new insights, we pivoted to create a new message and goal of the report:
Instead of focusing on communicating the data alone, we decided to focus this report on what we can expect with this trajectory in the future, when more data has been collected to give us more clear insights.
After creating an outline of the content together, my partner and I then went on to work individually on our own tasks. While my partner was writing the copy for each section, I started drafting ideas for the report design.

Ideate
Drafting and prototyping
After collaborating on the content structure with my partner, I scheduled a meeting with CSLD’s directors to gather relevant information on their wants and needs from the report design.
Moodboards and sketches
After meeting with our stakeholders, I created and presented a moodboard that visually communicated their ideas, wants, and needs.
This allowed us to align on a general theme and direction for the report design.

Drafting and prototyping
In my first design draft, my goal was to have all of our existing content laid out so we could see how things feel visually. I made two variations of the report using the colors we had selected from our previous design meeting, and presented them to the team to see which one they would prefer.
Test
Feedback and revisions
Once the team had agreed on a design theme, I produced a test print of the report so we could have a physical prototype to review.
Reviews and Feedback
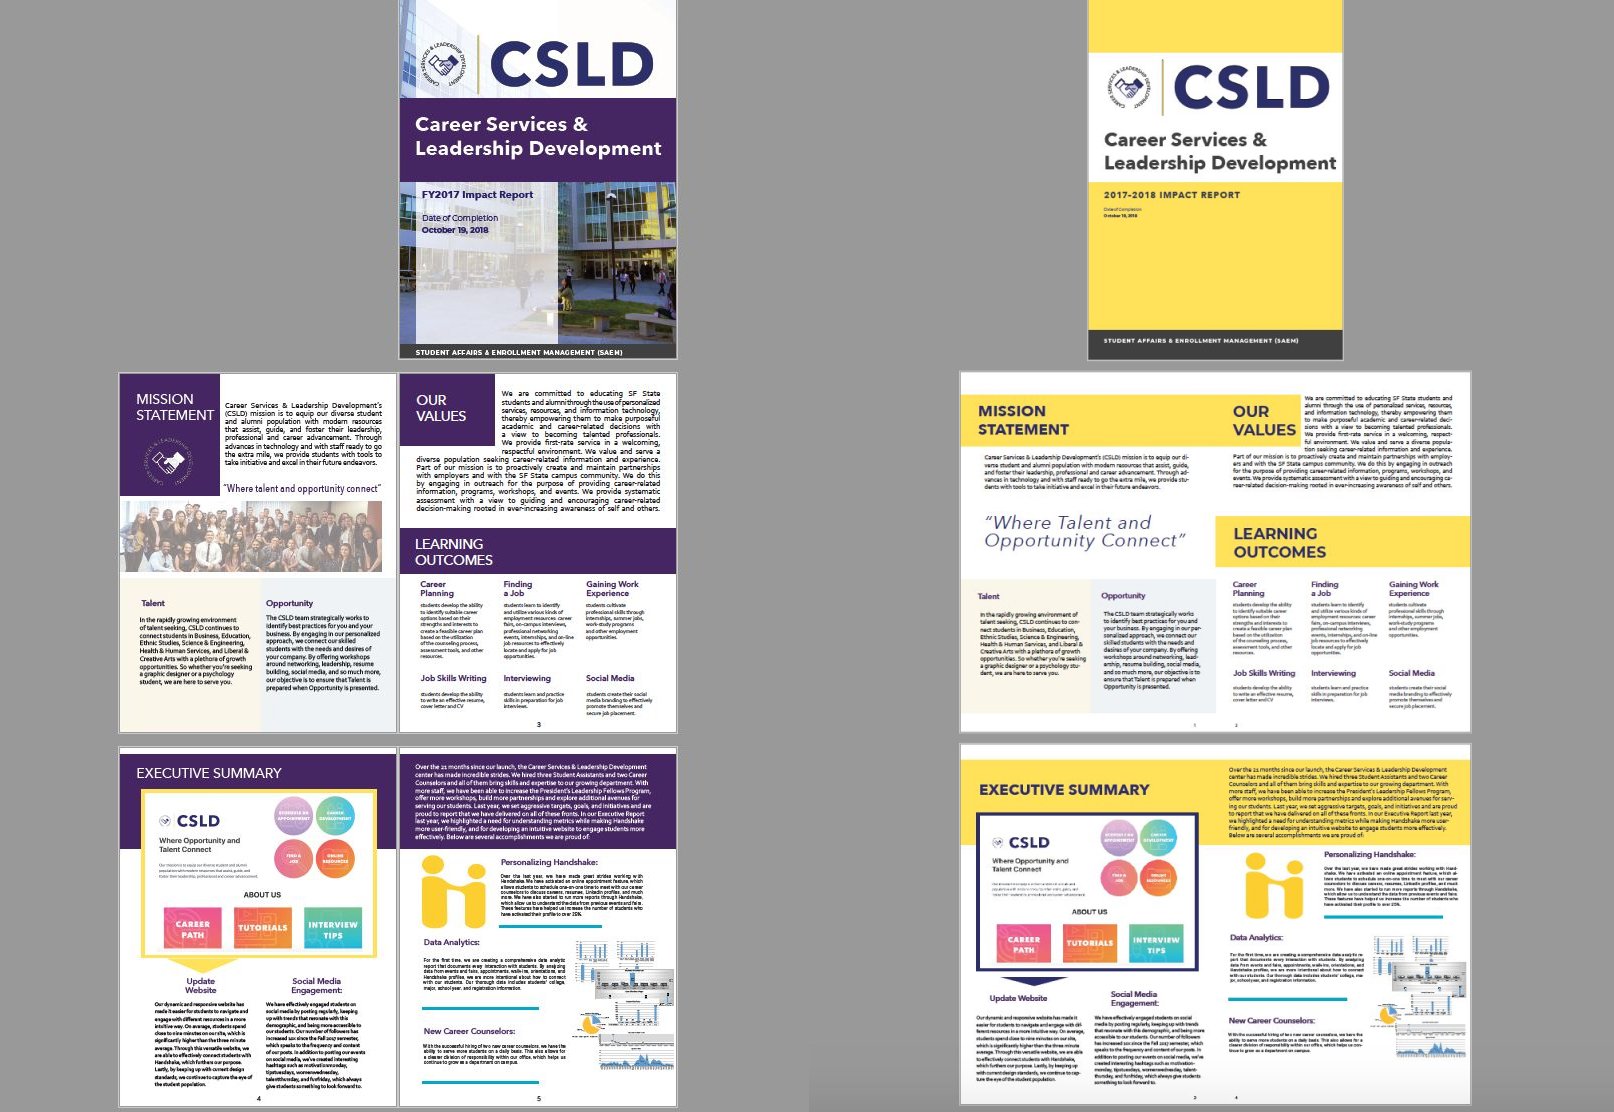
Our first test print was a draft of one of my original explorations. With a physical prototype in hand, the team was able to scan through and suggest edits with ease. However, after some time with the physical prototype, our main stakeholders found issues with the formatting and feel of the report in a portrait orientation.
As a final revision, I was asked to translate the design into a landscape format.

Last Minute Revisions
To fulfill our stakeholders’ requests, I was able to translate the design into a landscape format by using the same general design components and layouts from our previous iterations. I then repeated this process of running test prints and receiving feedback until our copy was finalized and ready for print.

Delivery and Implementation
Final Design


Other Projects
-
![]()
Typography Publication
A personal favorite from design school: an 8-page Baskerville type specimen focused on storytelling through composition
-
![]()
Annual Report Publication
CSLD’s second annual impact report, 2019
-
![]()
Marketing & Promotion
A case study and collection: 2+ years of print and digital marketing for CSLD events, workshops, fairs, and services
-
![]()
Internal Branding & Collateral
A collection of internal branding and collateral projects for CSLD’s services


